Now let´s see if you can apply the 5 Actions to solve these exercises.
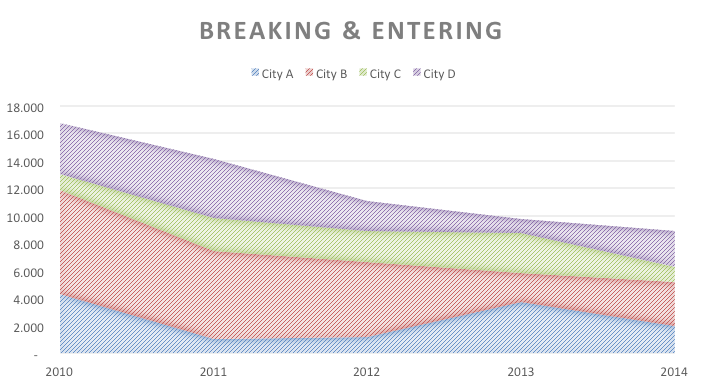
Assessment 1: Breaking and Entering
Create a graph or chart using a software to show the following data:
Comparison of numbers of burglaries in the following cities between the years 2010 and 2014
| Année | Ville A | Ville B | Ville C | Ville D |
| 2010 | 4.300 | 7.600 | 1.100 | 3.760 |
| 2011 | 1.000 | 6.400 | 2.430 | 4.300 |
| 2012 | 1.200 | 5.400 | 2.300 | 2.200 |
| 2013 | 3.690 | 2.160 | 2.900 | 1.000 |
| 2014 | 1.960 | 3.200 | 1.130 | 2.600 |

This graph adds the numbers of breaking and enterings in the years e.g. 2010: blue shows 4300, red 7600 (4300+7600 =11900) and so on… so we can a) make estimations for specific a specific city and b) for all cities.
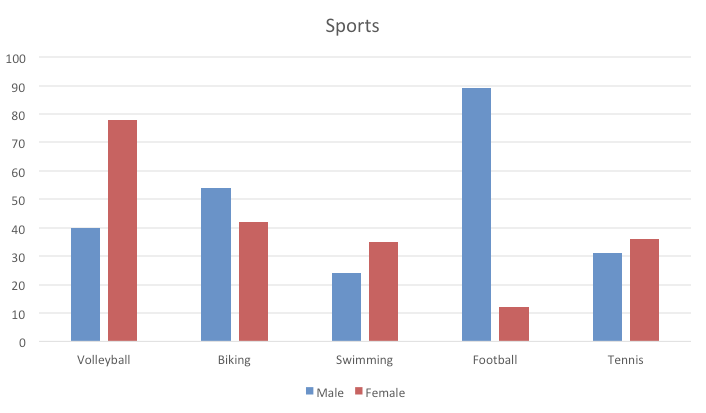
Assessment 2: Sports
Create a graph or chart using a software to show the following data:
What sport do students do, differentiated by gender?
| Male | Female | |
| Volleyball | 40 | 78 |
| Biking | 54 | 42 |
| Swimming | 24 | 35 |
| Football | 89 | 12 |
| Tennis | 31 | 36 |

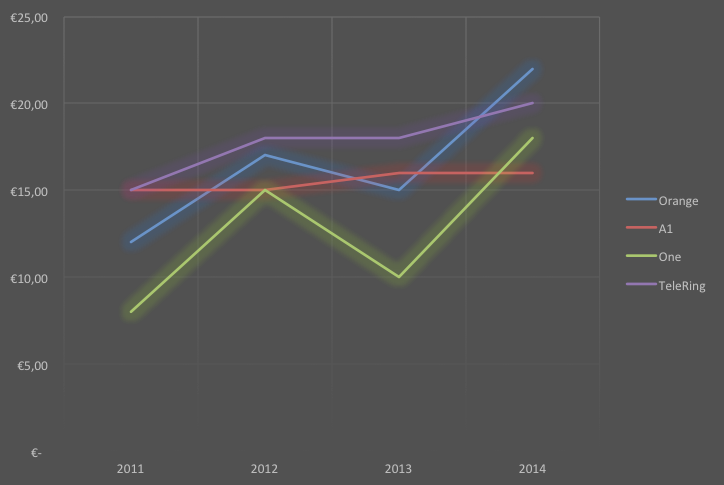
Assessment 3: Mobile phone costs
Create a graph or chart using software to show the following data:
How did the mobile phone costs (in €) per month change over time looking at different providers?
| Années | Opérateur A | Opérateur B | Opérateur C | Opérateur D |
| 2011 | € 12,00 | € 15,00 | € 8,00 | € 15,00 |
| 2012 | € 17,00 | € 15,00 | € 15,00 | € 18,00 |
| 2013 | € 15,00 | € 16,00 | € 10,00 | € 18,00 |
| 2014 | € 22,00 | € 16,00 | € 18,00 | € 20,00 |

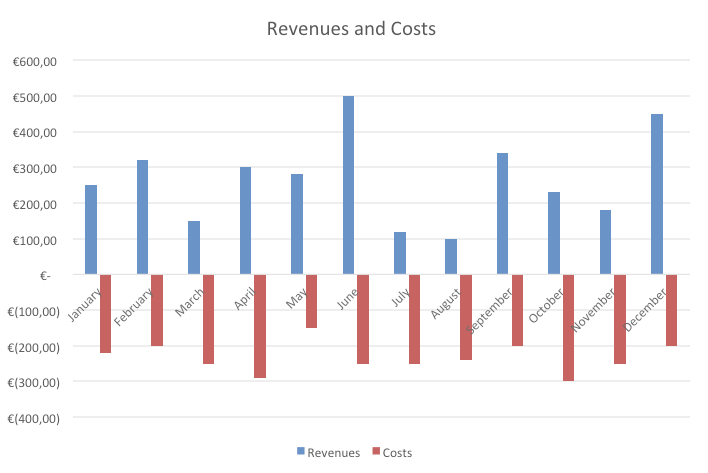
Assessment 4 -Monthly Costs and Revenues
Create a graph or chart using a software to show the following data.
A student wants to look at his monthly costs and revenues:
| Mois | Recettes | Dépenses |
| Janvier | € 250,00 | -€ 220,00 |
| Février | € 320,00 | -€ 200,00 |
| Mars | € 150,00 | -€ 250,00 |
| Avril | € 300,00 | -€ 290,00 |
| Mai | € 280,00 | -€ 150,00 |
| Juin | € 500,00 | -€ 250,00 |
| Juillet | € 120,00 | -€ 250,00 |
| Août | € 100,00 | -€ 240,00 |
| Septembre | € 340,00 | -€ 200,00 |
| Octobre | € 230,00 | -€ 300,00 |
| Novembre | € 180,00 | -€ 250,00 |
| Décembre | € 450,00 | -€ 200,00 |


