Now it is your turn. Have a go at creating an infographic. Create Infographics based on the data.
Remember the 7 Creative Steps to create infographics. The first exercises will show you a possible infographic.
Keep in mind there are thousands of ways.
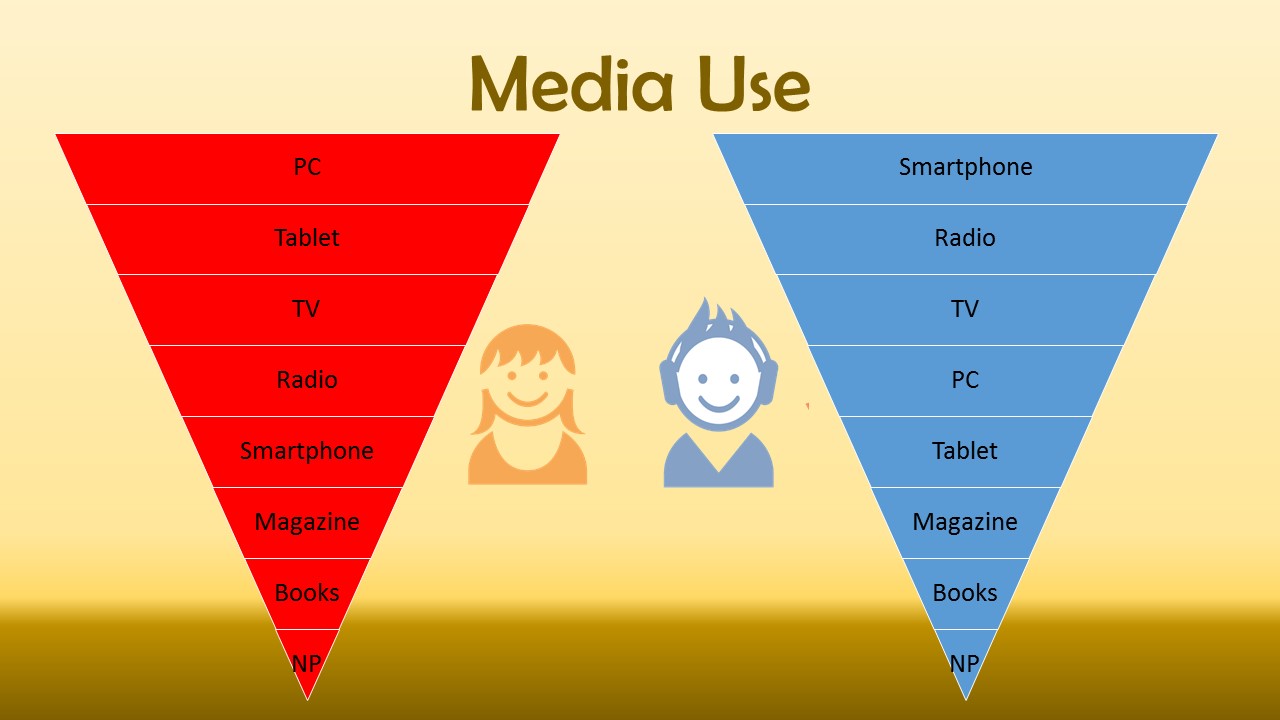
Exercise 1 – Media use
Studies often focus on differences in behaviour depending on your gender. In this study you can read about different ways that students primarily access information.
Here below the table shows the answers of students that have been asked:
| Media | Students male | Students female |
| TV | 25 | 32 |
| PC | 13 | 35 |
| Smartphone | 42 | 20 |
| Tablet | 12 | 34 |
| Radio | 40 | 23 |
| Books | 3 | 5 |
| Newspapers | 2 | 2 |
| Magazines | 6 | 14 |
| 143 | 165 |
Creative step 1: Create pictures for the items
Creative step 2: Use the templates that come with PowerPoint and keep it simple.
Creative step 3: Find a way to show large numbers and small numbers.
Creative step 4: Add words and numbers if necessary
Creative step 5: Find a suitable background
Creative step 6: Create a meaningful title
Creative step 7: Save it as a presentation and then as picture in a jpg.
Now create your own infographic!
Afterwards you can compare it with our possible solution:

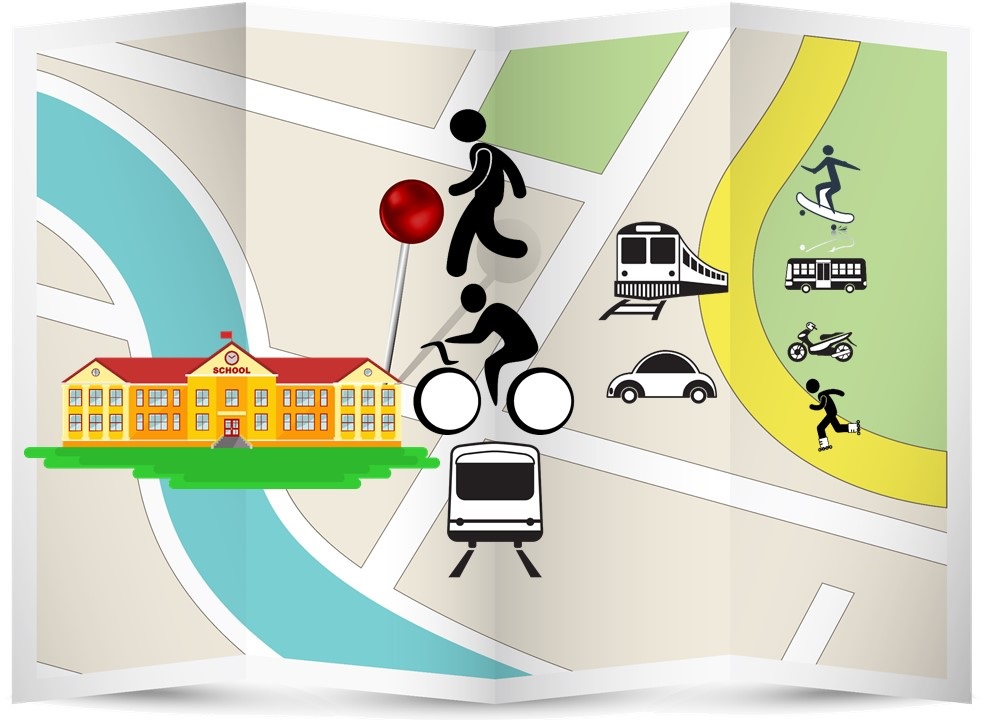
Exercise 2 – How do you get to school?
Students were asked what means of transportation they use to get to school.
| Patience | Precision | Organisation | Tidiness | Helpfulness | Teamplayer | |
| Electrician | 1 | 4 | 2 | 1 | 2 | 2 |
| Nurse | 3 | 4 | 3 | 4 | 4 | 3 |
| Teacher | 4 | 3 | 4 | 1 | 4 | 0 |
| Chef | 2 | 3 | 4 | 4 | 1 | 4 |
Creative step 1: Create pictures for the items
Creative step 2: Use the templates that come with PowerPoint and keep it simple.
Creative step 3: Find a way to show large numbers and small numbers.
Creative step 4: Add words and numbers if necessary
Creative step 5: Find a suitable background
Creative step 6: Create a meaningful title
Creative step 7: Save it as a presentation and then as picture in a jpg.
Now create your own infographic!
Afterwards you can compare it with our possible solution:

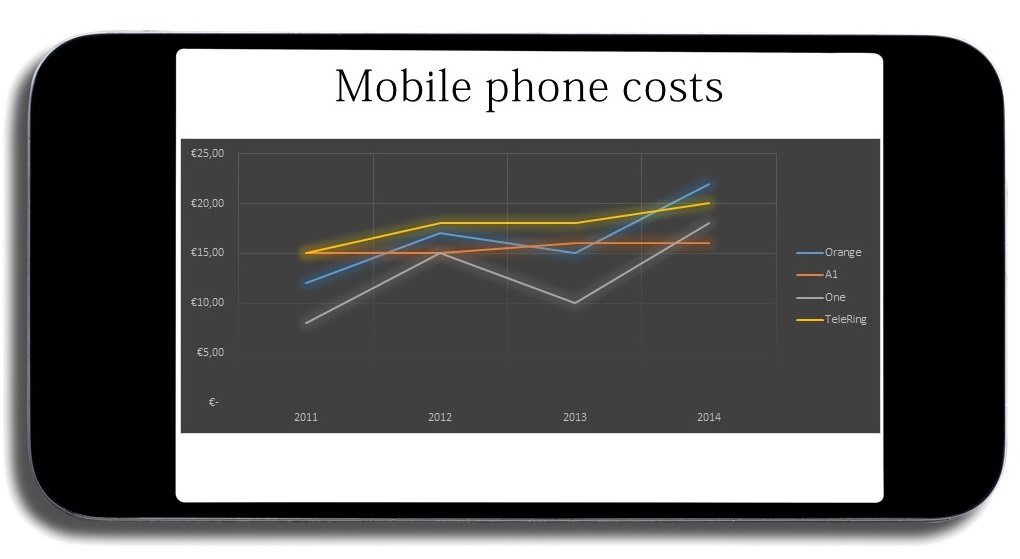
Exercise 3 – Mobile phone costs
How did the mobile phone costs (in €) per month change over time looking at different providers?
| Années | Opérateur A | Opérateur B | Opérateur C | Opérateur D |
| 2011 | € 12,00 | € 15,00 | € 8,00 | € 15,00 |
| 2012 | € 17,00 | € 15,00 | € 15,00 | € 18,00 |
| 2013 | € 15,00 | € 16,00 | € 10,00 | € 18,00 |
| 2014 | € 22,00 | € 16,00 | € 18,00 | € 20,00 |
Creative step 1: Create pictures for the items
Creative step 2: Use the templates that come with PowerPoint and keep it simple.
Creative step 3: Find a way to show large numbers and small numbers.
Creative step 4: Add words and numbers if necessary
Creative step 5: Find a suitable background
Creative step 6: Create a meaningful title
Creative step 7: Save it as a presentation and then as picture in a jpg.
Now create your own infographic!
Afterwards you can compare it with our possible solution:

Exercise 4 -Monthly Costs and Revenues
Task: Create an infographic for the month October.
A student wants to look at his monthly costs and revenues:
| Mois | Recettes | Dépenses |
| Janvier | € 250,00 | -€ 220,00 |
| Février | € 320,00 | -€ 200,00 |
| Mars | € 150,00 | -€ 250,00 |
| Avril | € 300,00 | -€ 290,00 |
| Mai | € 280,00 | -€ 150,00 |
| Juin | € 500,00 | -€ 250,00 |
| Juillet | € 120,00 | -€ 250,00 |
| Août | € 100,00 | -€ 240,00 |
| Septembre | € 340,00 | -€ 200,00 |
| Octobre | € 230,00 | -€ 300,00 |
| Novembre | € 180,00 | -€ 250,00 |
| Décembre | € 450,00 | -€ 200,00 |
Creative step 1: Create pictures for the items
Creative step 2: Use the templates that come with PowerPoint and keep it simple.
Creative step 3: Find a way to show large numbers and small numbers.
Creative step 4: Add words and numbers if necessary
Creative step 5: Find a suitable background
Creative step 6: Create a meaningful title
Creative step 7: Save it as a presentation and then as picture in a jpg.
Now create your own infographic!
Afterwards you can compare it with our possible solution:

Exercise 5 – Jobs and their characteristics
If you think about your future and you think about the work you would like to do, you can read up on characteristics needed for a certain job. So it is easier to decide what kind of job you would like to do and you might be good at.
The table below contains the opinions collected for a survey by the employment service center.
1 = not important | 2 = needed sometimes | 3 = important | 4 = very important
| Patience | Precision | Organisation | Tidiness | Helpfulness | Teamplayer | |
| Electrician | 1 | 4 | 2 | 1 | 2 | 2 |
| Nurse | 3 | 4 | 3 | 4 | 4 | 3 |
| Teacher | 4 | 3 | 4 | 1 | 4 | 0 |
| Chef | 2 | 3 | 4 | 4 | 1 | 4 |
Creative step 1: Create pictures for the items
Creative step 2: Use the templates that come with PowerPoint and keep it simple.
Creative step 3: Find a way to show large numbers and small numbers.
Creative step 4: Add words and numbers if necessary
Creative step 5: Find a suitable background
Creative step 6: Create a meaningful title
Creative step 7: Save it as a presentation and then as picture in a jpg.
Now create your own infographic!
If you need inspiration, go and search in the internet for infographics on this topic.
Exercise 6 – Following Social Media
Do you use social media? What kind do you use? And for how many hours per day? In this table you can find the likes of students and average hours per day that they use it.
| Media | Students male | Students female |
| TV | 25 | 32 |
| PC | 13 | 35 |
| Smartphone | 42 | 20 |
| Tablet | 12 | 34 |
| Radio | 40 | 23 |
| Books | 3 | 5 |
| Newspapers | 2 | 2 |
| Magazines | 6 | 14 |
| 143 | 165 |
Creative step 1: Create pictures for the items
Creative step 2: Use the templates that come with PowerPoint and keep it simple.
Creative step 3: Find a way to show large numbers and small numbers.
Creative step 4: Add words and numbers if necessary
Creative step 5: Find a suitable background
Creative step 6: Create a meaningful title
Creative step 7: Save it as a presentation and then as picture in a jpg.
Now create your own infographic!
If you need inspiration, go and search in the internet for infographics on this topic.
Exercise 7: Breaking and Entering
Create an infographic using a software to show the following data.
Comparison of numbers of burglaries in the following cities over time.
| Année | Ville A | Ville B | Ville C | Ville D |
| 2010 | 4.300 | 7.600 | 1.100 | 3.760 |
| 2011 | 1.000 | 6.400 | 2.430 | 4.300 |
| 2012 | 1.200 | 5.400 | 2.300 | 2.200 |
| 2013 | 3.690 | 2.160 | 2.900 | 1.000 |
| 2014 | 1.960 | 3.200 | 1.130 | 2.600 |
Creative step 1: Create pictures for the items
Creative step 2: Use the templates that come with PowerPoint and keep it simple.
Creative step 3: Find a way to show large numbers and small numbers.
Creative step 4: Add words and numbers if necessary
Creative step 5: Find a suitable background
Creative step 6: Create a meaningful title
Creative step 7: Save it as a presentation and then as picture in a jpg.
Now create your own infographic!
If you need inspiration, go and search in the internet for infographics on this topic.
Exercise 8: Sports
Create a graph or chart using a software to show the following data.
| Male | Female | |
| Volleyball | 40 | 78 |
| Biking | 54 | 42 |
| Swimming | 24 | 35 |
| Football | 89 | 12 |
| Tennis | 31 | 36 |
Creative step 1: Create pictures for the items
Creative step 2: Use the templates that come with PowerPoint and keep it simple.
Creative step 3: Find a way to show large numbers and small numbers.
Creative step 4: Add words and numbers if necessary
Creative step 5: Find a suitable background
Creative step 6: Create a meaningful title
Creative step 7: Save it as a presentation and then as picture in a jpg.
Now create your own infographic!
If you need inspiration, go and search in the internet for infographics on this topic.


