Once you have decided what kind of graph to use, it is time to create it.
Creating graphs works best when you use a suitable spread sheet software. You can always use Microsoft Excel but there are other ways as well. Let´s start:
- Choose a spread sheet software you like to work with.
- Download and save it.
- Try it out.
Choose a spread sheet software
Here you can find useful links to freeware. Read through them. Look at samples on the websites. Maybe a friend or teacher has a suggestion which software might be suitable for you. To find a program you like, you might need to try different ones. It is as everything in life: you never know until you tried. Follow you instinct and try one out!
Kingsoft Spreadsheets Free 2013 is totally free spreadsheet software alternative to Microsoft Excel that offers a wide range of easy-to-use features which suits both beginners and advanced users.
Open Office Calc is a free spreadsheet software. Calc a powerful spreadsheet with all the tools you need to calculate, analyze, and present your data in numerical reports or sizzling graphics.
Accel Spreadsheet is a standalone component of SSuite Office. Accel Spreadsheet is basically a spreadsheet software like Microsoft excel.
Spreadsheet123 is a simple spreadsheet which lets you monitor your spending habits. It is useful for creating a monthly or yearly household budget. It offers spreadsheets for different occasions such as: Household Budget Worksheet, party budget planner, event fund raiser, college student’s budget and weekly timesheet template.
QT Calc Express is a free spreadsheet software. It lets you do data analysis, calculations, create various types of charts and graphs, creation of reports and formatting your data.
Gnumeric is a free spreadsheet software based upon GNOME. It is a free alternative to popular spreadsheet software Microsoft excel.
Myrtle is a free spreadsheet software which is programmable and used for statistical analysis. It includes all the functions related to mathematics, probability, statistics and computer science.
CellPro is a free spreadsheet software. It lets you do data calculations, data analysis, and construct formulas for you.
PlanMaker is a free and powerful spreadsheet application. It is a part of the Softmaker free office software. It lets you create graphs, charts, borders and WordArt.
Calligra Sheets is a free and powerful spreadsheet application. It is an free alternative to Microsoft Excel. It lets you create charts and graphs.
Source of these links and for more information
Download and save it
Using the PC gets easier the more often we do it. If you need help to download and save software, this link will help you.
If you prefer a video tutorial how to download software, you can watch this video:
Try it out
Look at our example and the graphs we produced using a software. In the LEARN section of this chapter you will also find useful information how to create your graph.
For a project for biology we looked at feeding habits of animals and started to be interested what the “eating habits” of students in our school were like. For clear differentiation we used the biological terms. We interviewed students and prepared a table where we put the outcomes of the interview:
| Omnivores | Pesco-végétariens | Végétariens | Lacto- végétariens | Ovo- végétariens | Véganes | |
| Filles | 15 | 25 | 37 | 24 | 9 | 14 |
| Garçons | 34 | 16 | 11 | 13 | 5 | 2 |
| Total | 49 | 41 | 48 | 37 | 14 | 16 |
A Pescatarian maintains a vegetarian diet with the addition of fish and other sea foods such as shrimp and lobster.
A Vegetarian is a person who does not eat meat, poultry, and fish. Vegetarians eat mainly fruit, vegetables, legumes, grains, seeds, and nuts. Many vegetarians eat eggs and/or dairy products but avoid hidden animal products such as beef and chicken stocks, lard, and gelatin.
Lacto-vegetarian is a term sometimes used to describe a vegetarian who does not eat eggs, but does eat dairy products.
Ovo-vegetarian refers to people who do not eat meat or dairy products but do eat eggs.
Veganism is a way of living which seeks to exclude, as far as is possible and practicable, all forms of exploitation of, and cruelty to, animals for food, clothing or any other purpose. A vegan diet is richly diverse and comprises all kinds of fruits, vegetables, nuts, grains, seeds, beans and pulses.
To learn more about internet researches you can use:
Google, Bling, Yahoo! Search, Ask, Wow, WebCrawler and many moreHow to use Google
Tips for Getting More Precise Hits
Remember the 3 Steps from chapter 3 to choose the most suitable graph:
Step 1: Look at title, words and pictures. What does the table show?
Step 2: Look at the numbers. What do the numbers tell you?
Step 3: Choose a type of graph for these data. What kind of graph would you choose to effectively represent the data?
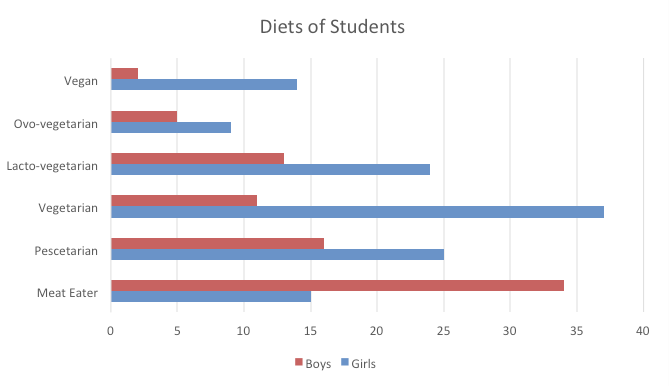
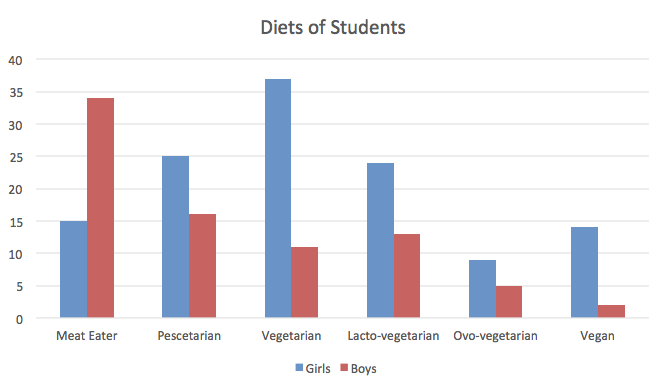
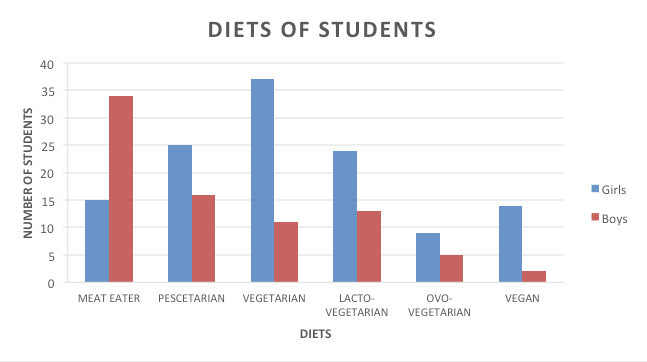
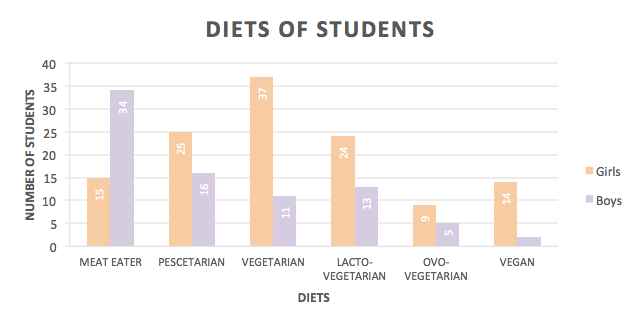
We have decided to use a bar chart because we COMPARE the eating habits of boys and girls.
Once you made the choice you can still play around and create the graph you think looks best.


As you can see, there are many different ways. For example you can always use your favourite colours suitable to match the task.
How to create such a graph, you can learn in the next chapter.


