Useful phrases to interpret a graph
As every graph tells a story, the creator has to be a good story teller. She or he needs basic knowledge in creating and interpreting the graphs produced. Also the person trying to understand the story, needs some basic knowledge about graphs. Otherwise reading a graph is like reading a text in a foreign language.
Introducing …
| THE TOPIC | THE GRAPH |
| I’d like you to look at … | This graph shows… |
| Let me show you … | The diagram outlines… |
| Let’s have a look at … | This table lists… |
| Let’s turn to… | This chart represents… |
| To illustrate my point let’s look at… | This chart depicts… |
| As you can see from these… | This chart breaks down… |
| If you look at … you’ll see/notice/understand… |
Some vocabulary you need to know:
| To go up: | increase, rise, rocket, climb, lift, grow, go up, jump, surge, shoot up, soar, rocket, a rise, an increase, growth, an upward/rising/increasing trend, an improvement, a jump, a surge, extend, expand, push/put/step up, progression |
| To go down | decrease, drop, decline, fall, go down, slump, plummet, a fall, a decrease, a decline, a downward/falling/decreasing trend, a slump |
| No change | Remain stable/constant/steady at, stay at the same level, stabilize, keep stable, hold constant |
| Indicating a change of direction | level out/off, stand at, stop falling/rising, stop falling and start rising, stop rising and start falling, change |
| Frequent change | Fluctuate, fluctuation |
| At the top | Reach a peak, peak, reach its/their highest point |
| At the bottom | Reach/hit a low (point), hit/reach its/their lowest point |
Change can be described concerning their change:
| degree | dramatic(ally), vast(ly), huge(ly), a lot, significant(ly), considerable/ly, moderate(ly), slight(ly), substantial(ly), a little |
| speed | rapid(ly), quick(ly), swift(ly), gradual(ly), gentle/ly, little by little, slow(ly), quiet(ly) |
Some prepositions for describing elements in a graph
| Prepositions | A rise FROM x TO y |
| TO INCREASE BY 5 % | |
| AN INCREASE OF 5 % IN kestrel sightings |
How well can you read graphs?
Try your skills: Watch this 8-minute -video to learn more about vocabulary to use for interpreting graphs. Let´s continue with our example of mice and kestrels from the previous chapter. In our example Roy counted how many kestrels and how many field mice are in a field. For many years he notes the numbers in his diary. He produced this line chart. Let´s try to interpret this example carefully. First you have to read the labels and the legend of the diagram. What does it visualize? In our example… So this diagram visualises how many kestrels and field mice have been sighted over the years by Roy. First we have to read the most important points. Important points are peaks, lows, turning points and intersection points. In our example… Now it is important to define all significant trends. In our example… Sightings of kestrels: Sightings of field mice: Knowing the trends, we can compare them, to find out differences and relations. In our example… Finally we can establish hypotheses how the data is related. These hypotheses have to be questioned and assessed. In our example… A) “Mice eat kestrels. Therefore there are many kestrels when there are less mice.” B) “The kestrels hunt the mice. Therefore there can only be a lot of mice when there are fewer kestrels.” C) “The Mice hide from the kestrels. When there are many kestrels to see, we cannot see many mice.” D) “The relation between sightings of kestrels and mice is only a translucent connection. The numbers of sightings have very different reasons.” Based on the development of the diagram and the established hypothesis we can predict future developments of the diagram. In our example… A diagram helps to draft a hypothesis. To check a hypothesis very often you need to do an experiment. Based on a diagram, graph or chart we can predict a development in the future. But we have to be aware that it is only a prediction. This example about kestrels and mice has been published by courtesy of de.serolo.org. Concept and graphs by author Martin Forster. You can find the original under: https://de.serlo.org/biologie/kompetenzen-in-der-biologie/diagramme/wie-wertet-man-ein-diagramm-aus
Getting to know the 6 Analysis Steps to interpret a graph
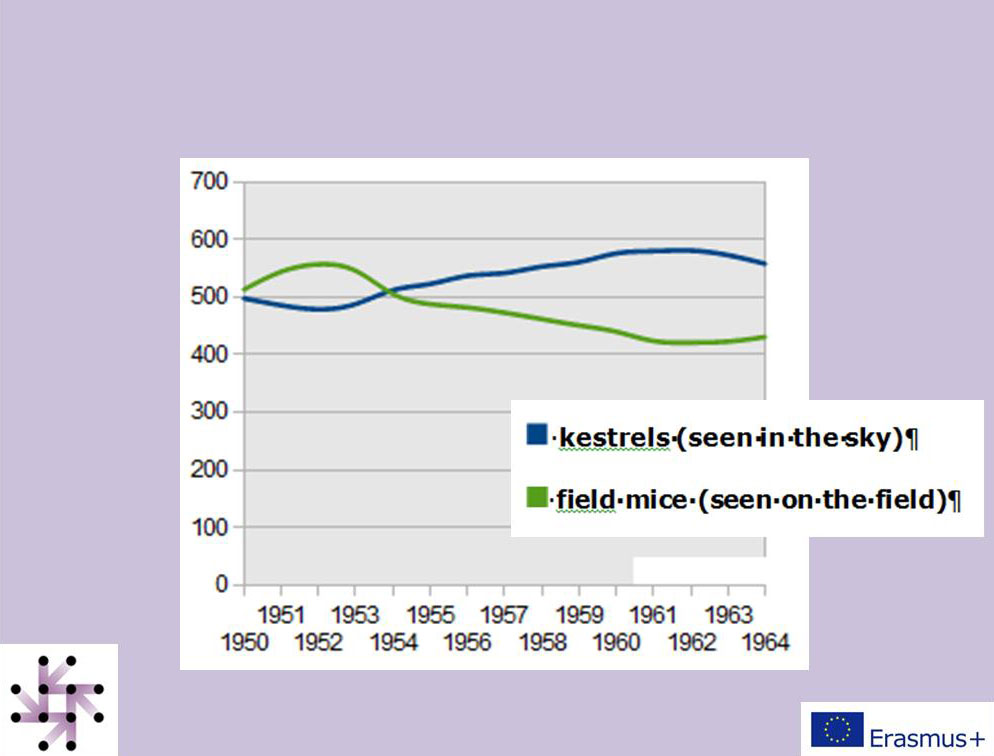
Analysis 1: Reading basics
Analysis 2: Reading important numbers
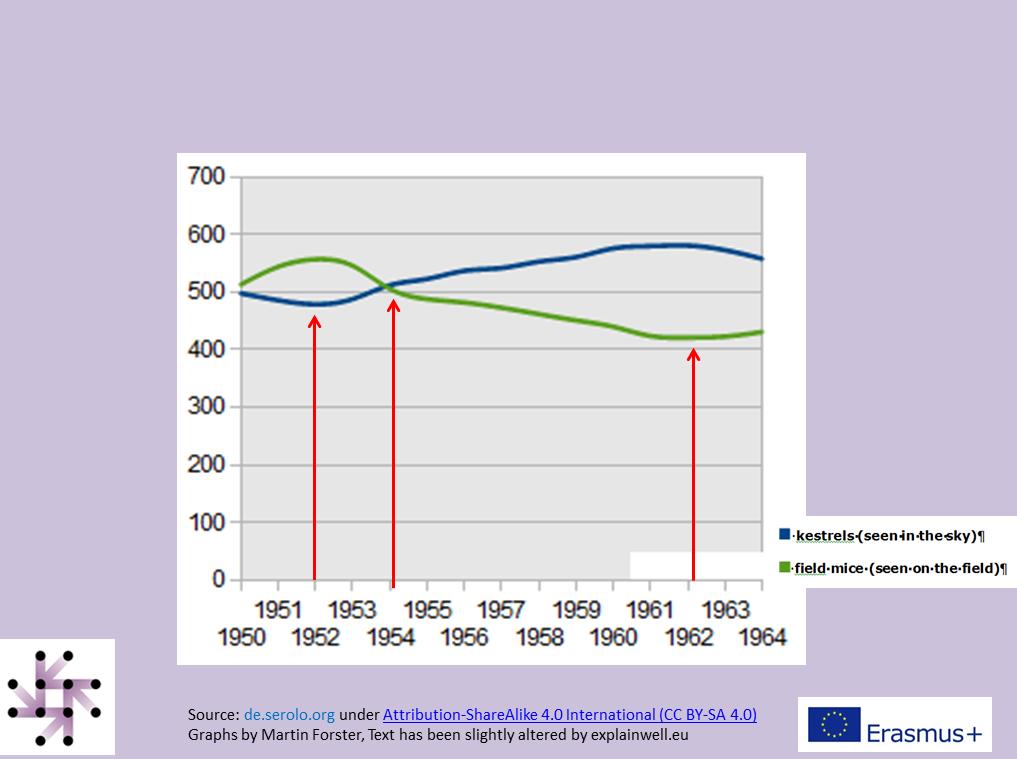
Analysis 3: Define trends
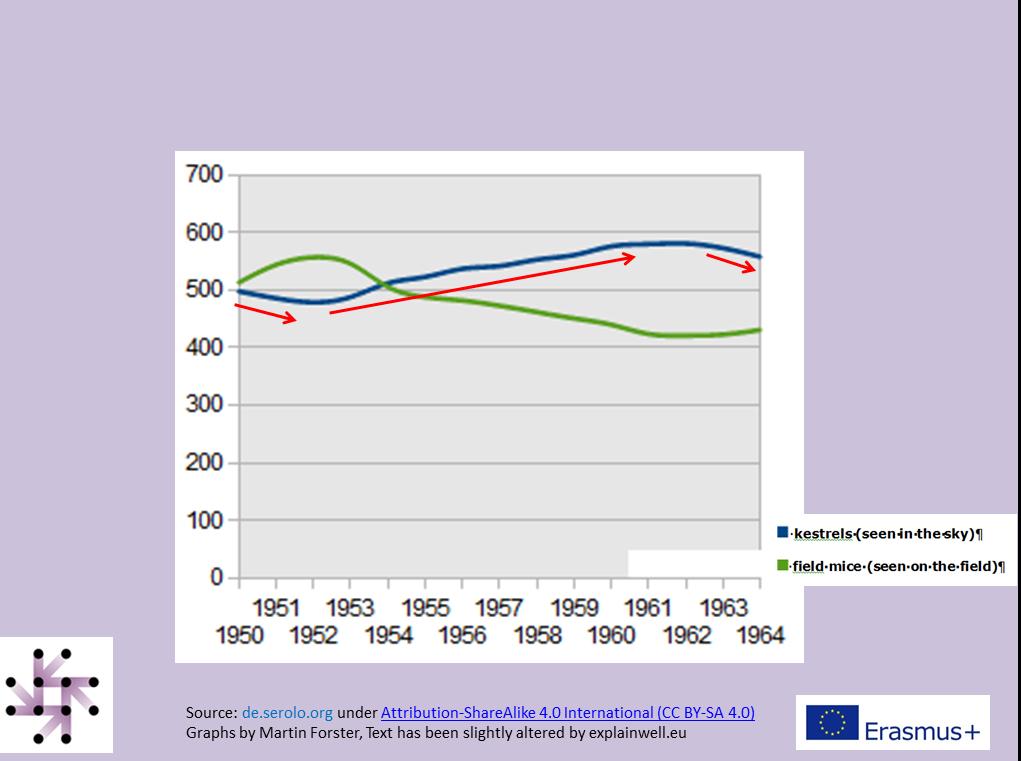
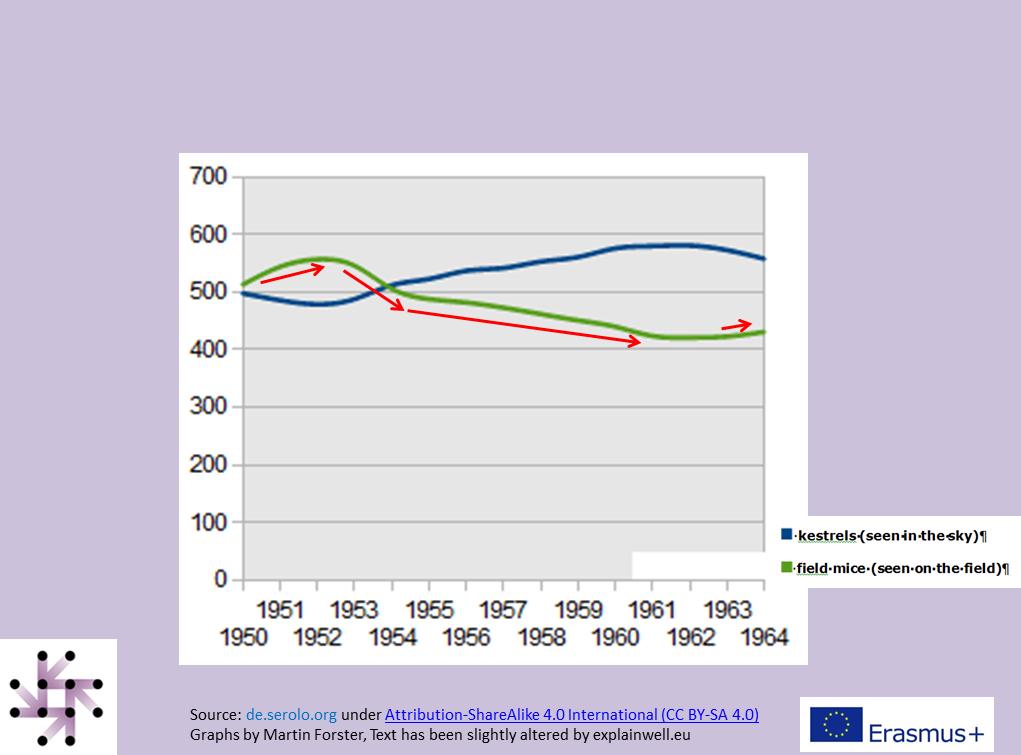
Analysis 4: Compare trends
Are there common trends?
Is there a pattern?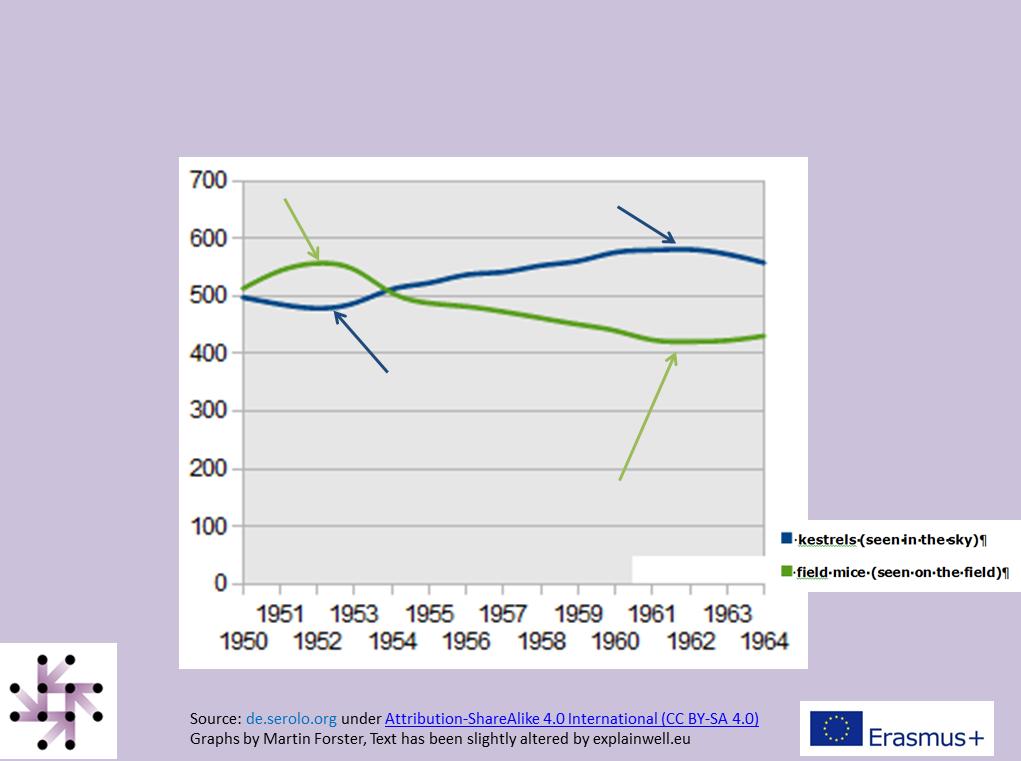
Analysis 5: Analyse trends
Analysis 6: Predict a development
But be careful: Predictions are always only speculations!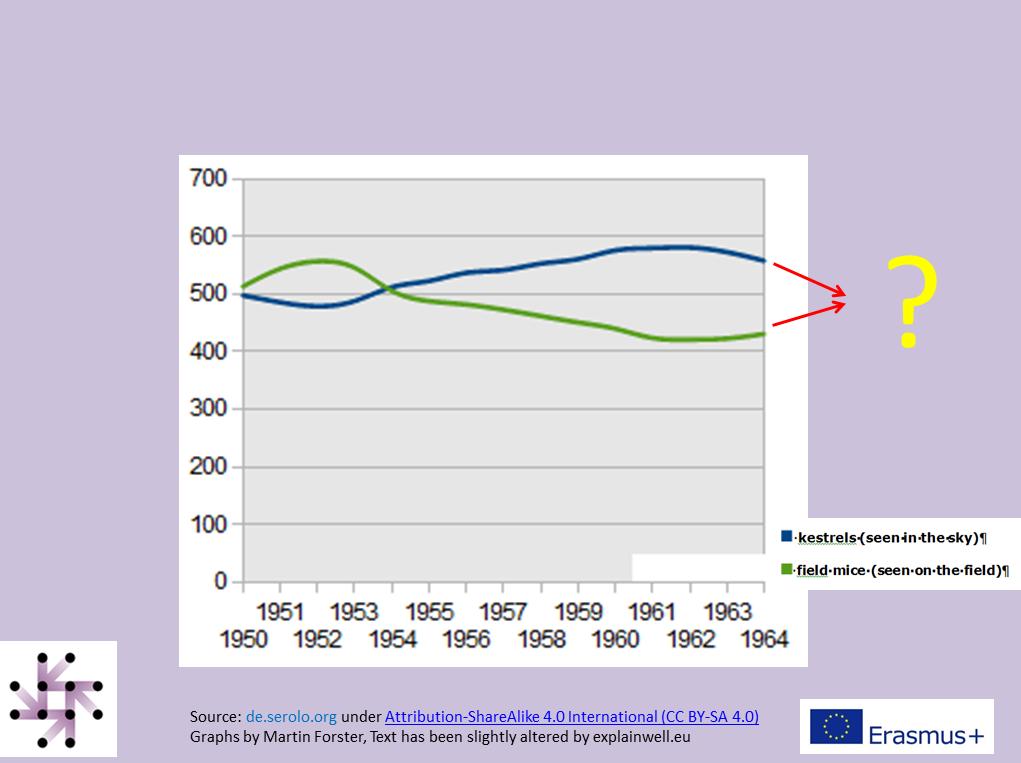
Conclusion
Note: Some words in the graphs have been deleted to make it suitable for international use. Arrows to explain graphs have been added.
Some text has been changed slightly to suit the audience of explainwell.eu.
Serlos work is under Attribution-ShareAlike 4.0 International (CC BY-SA 4.0)


