Tips to create Infographics
When using infographics there are a lots of possible solutions. Your creativity has no limits when using infographics. Even for designers producing a good infographic can be quiet challenging. Remember: He Who Dares, Wins!!
Here we have collected some tips for you how to create an easy infographic.
- Find a software you like to work with. Links to suitable software you find in the DISCOVER section of this chapter.
- Before starting to use software, try to imagine what it could look like. You could draw a sketch on a piece of paper. You could also search the internet for ideas.
- Use pictures that clearly say what you want to say.
- Use suitable pictures for your audience. Ask yourself: who do I want to address? What kind of pictures does my audience like to look at?
- Check the licence right of your pictures. You can learn more about this in the next chapter 5.2.2.
- “What do you think I want to show in this infographic?” Test your infographic on a friend or family member. Ask them for improvement. The higher the importance of your infographic, the more opinions you should gather.
Neil Patel is the Chief Evangelist of KISSmetrics and blogs at Quick Sprout.
Here his “12 Infographic Tips That You Wish You Knew Years Ago”
Some more links if you would like to learn more:
What You Can Learn From These 10 Infographics – Here you can read about a range of 10 contemporary infographics and some key takeaways that you can gain from each individual design. The 90 best infographics – The best infographics may look like they were simple to create in Photoshop, but designing an effective piece of data visualization is usually anything but. Here some great examples. Would you like some tips for creating successful infographics? Here are 7 tips for creating successful infographics 7 Super Tips for Creating Powerful Infographics – With the rise of the “visual web,” content marketing is becoming more image-centric. As we embrace this trend of marketing without words and communicating visually, infographics have become one of the most effective ways to share your message, establish authority and drive traffic and shares across social platforms … 5 Steps to Creating a Powerful Infographic – To be successful, an infographic needs resonant content and great design. Here are 5 tips for creating an effective infographic. And some more Top Tips from Experts on What Makes a Great Infographic 10 Tips for (journalists) Designing Infographics – A good infographic will not only inform readers, but will also create interest and convince people to read your article similar to how good headlines and photos attract readers. Here are 10 tips for designing better infographicsAbout licence rights of pictures
If you want to use pictures that you find in the internet to publish, for example for a study work or on social media, you need to know how to find pictures with the correct license rights.
In Google you can find pictures with a suitable licence like that:
- Search for images using keywords as usual.
- When results are returned click “Search Tools”
- Choose “Usage Rights”. Select an option from the dropdown menu.
5 important facts about using photos form the internet and rules for using images on blogs
- Who is the owner of a photo?
The moment you take a photograph, you own the copyright to it.
- Can I use photos that are published in social media for public presentations?
Content that’s published online is still protected by copyright law. If you’ve ever downloaded images from the net and republished them, used them in posters or newsletters without permission, you may have been breaking the law.
- What are Creative Commons?
Creative Commons allow the owner to select permissions she/he wants to give to people, for free. With Creative Commons licensing you can give away all rights to your work, or just some of them. The most common licensing is an Attribution license, which lets anyone use your image in any way they like, as long as they give you credit.
- How can I find out about usage right on Google?
- Search for images using keywords as usual.
- When results are returned click “Search Tools”
- Choose “Usage Rights”. Select an option from the dropdown menu.
- What do I need to do if I want to use a picture and the licence right is not clear?
You should contact the original rights-holder for permission. Only use it if you have a written allowance.
You want to learn more about Creative Commons? You own great pictures and presentations you would like to be available for reuse by others?
From table and graph to infographic – the 7 creative Steps
We will teach you the 7 Creative Steps to create an infographic.
Let´s look at an example how to create an infographic.
For a project for biology we looked at feeding habits of animals and started to be interested what the “eating habits” of students in our school were like. For clear differentiation we used the biological terms. We interviewed students and prepared a table where we put the outcomes of the interview:
| Omnivores | Pesco-végétariens | Végétariens | Lacto- végétariens | Ovo- végétariens | Véganes | |
| Filles | 15 | 25 | 37 | 24 | 9 | 14 |
| Garçons | 34 | 16 | 11 | 13 | 5 | 2 |
| Total | 49 | 41 | 48 | 37 | 14 | 16 |
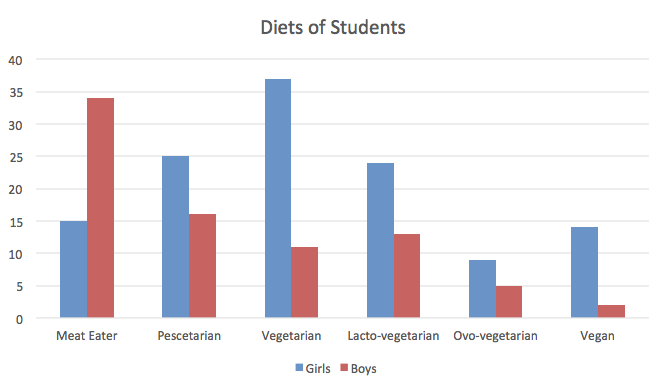
Now let´s see this data in a bar chart:

There are blue bars to show the likes of female students and red bars to show the likes of male students.
It is easy to see the preferred diets. Immediately you find out that most female students are vegetarians whereas male students prefer meat.
If you want to go further into detail you can look closer and read the numbers.
This graph is good, if you look for specific information.
But if you, as creator of the graph, would like to make more people interested in your data, a good tip is to use pictures.
When we see pictures that we can relate to – such as food in our case – we are far more likely to look at data.
Therefore you need to follow the 7 Creative Steps:
Creative step 1: Create pictures for the items
Associate for each item a meaningful picture (creative moment). Then create or find them.
In our example we could use a picture of meat to represent omnivores and a picture of fish to represent the diet of Pescatarian.
Creative step 2: Use a software that you can handle.
We used Powerpoint as it is fairly easy to create with pictures and add word and numbers.
Creative step 3: Find a way to show large numbers and small numbers.
Use the size of pictures to show the importance: big pictures represent big numbers, small pictures represent small numbers.
In our case we use circles of different sizes to show if a larger or smaller number of people prefer a diet.
Creative step 4: Add words and numbers if necessary
We added the letters “m” for males and “f” for females and the numbers of persons following this diet.
Creative step 5: Find a suitable background
We chose a light green. On this background is a good contrast to our pictures.
Creative step 6: Create a meaningful title
In our case it could be “Omnivores vs. Vegetarians”.
Creative step 7: Save it as a presentation and then as picture in a jpg.
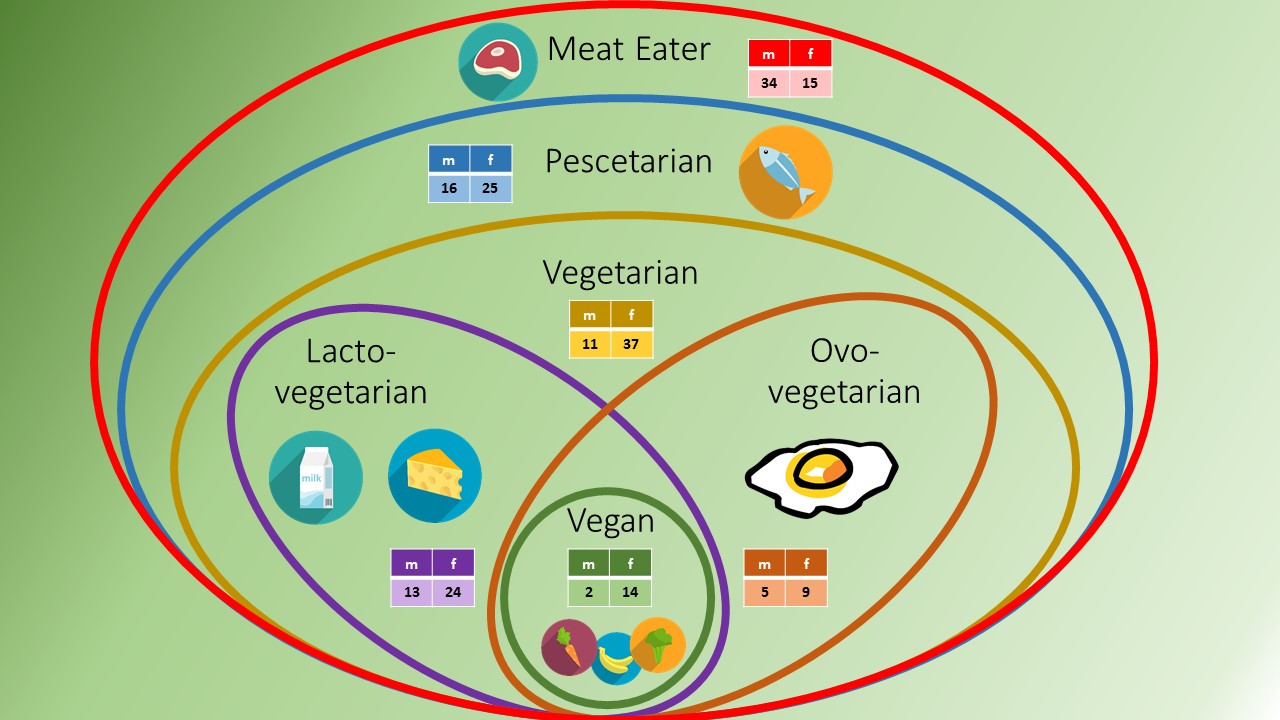
This is our infographic:

What information can you get out of this infographic?
Immediately we can grasp that the creator wanted to say something about different kinds of food diets and how eating habits can be divided into differerent groups, which move up from a small group (vegan) to larger groups (eg: vegetarian, pescetarian) by adding different food groups. Using the picture, different words are explained as well as just a statistic. Now it is clear that a lacto-vegetarian eats vegetables and fruits like a vegan, but also cheese and milk – even if you do not know the meaning of all words.
What can you interpret that Ovo-vegetarians eat?
Ovo-vegetarians include eggs as an animal product in their diet to supply their body with animal fat and animal protein – but they renounce diary products.
In this infographic it is less important to read the different likes according to gender. If you are interested, you can read the numbers – so everything our creator wanted to show is there.
Which of the 7 Steps did we not follow?
Go back and have a look?
Do you manage to find the mistake?
Creating an infographic with a Presentation Application
To learn to use PowerPoint or another presentation application there is only one way: GIVE IT A GO!
This 7 minute video tutorial will help you.
Let´s try and create an infographic for the following data using Powerpoint for the following data about Students’ food likes.
60 Students in a school have been interviewed about their food likes.
Here below the table shows their answers:
| Plats | Nb. D’étudiants |
| Pizza | 20 |
| Spaghetti Bolognese | 15 |
| Sausages | 6 |
| PotatoSalad | 3 |
| BakedBeans on toast | 2 |
| Lasagna | 10 |
| Roast turkey | 4 |
| Total number of students asked: | 60 |
Here are the 7 Creative Steps we recommend to create an infographic using a presentation application eg. PowerPoint:
Creative step 1: Create pictures for the items
Creative step 2: Use the templates that come with PowerPoint and keep it simple.
Creative step 3: Find a way to show large numbers and small numbers.
Creative step 4: Add words and numbers if necessary
Creative step 5: Find a suitable background
Creative step 6: Create a meaningful title
Creative step 7: Save it as a presentation and then as picture in a jpg.
Our final result is this picture:


