Knowing how to interpret graphs can help us make sense of the world around us. In our working life it has become a crucial skill, in factories graphs monitor production. In Business they use graphs to analyse their performance, even in music composing programs graphs are used to show music variations. In hospitals the inablitity to read graphs that are displayed on monitors can be dangerous.
You might find reading and interpreting graphs confusing and misleading. But bare in mine the creator of the graph wants to tell you something. Here an example:
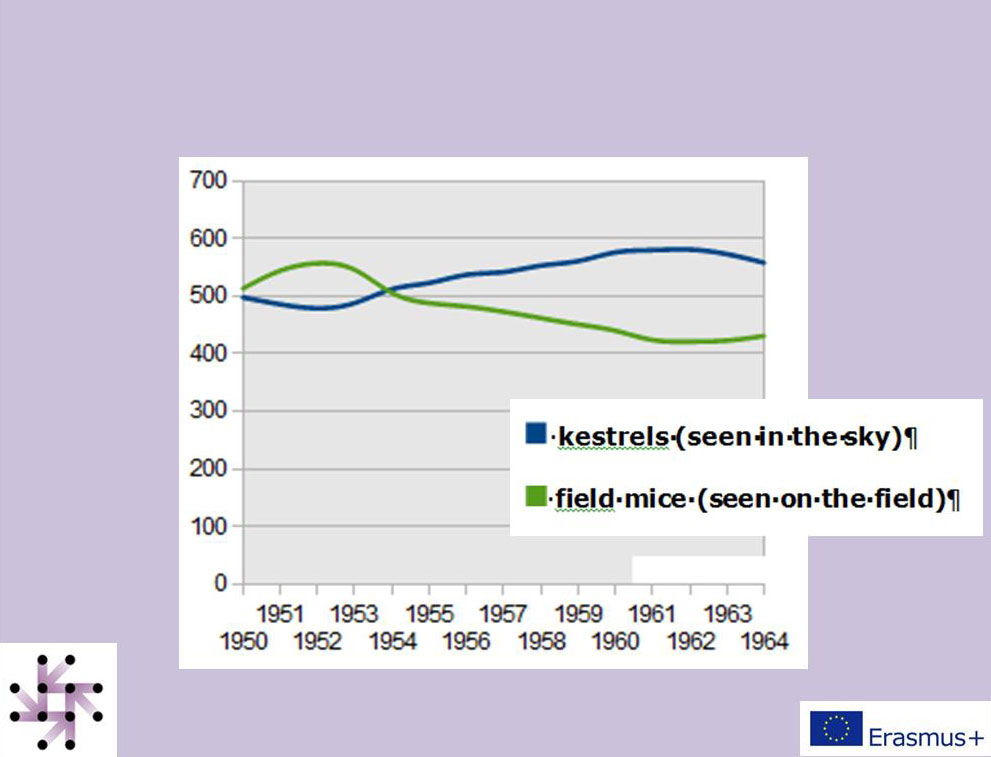
Before Roy Varey became a biologist he spent his school holidays at his grandparents. There was a huge field and he became interested in the animals living there. So he started his summer hobby: counting animals. His favourites were kestrels. As he realised that the numbers changed over the years, he started comparing their numbers with the number of their favourite prey: the field mice. For many years he noted the numbers in his diary. He wanted to compare the sightings of the years. Therefore he put the data into the form of a graph
Let´s find out what story this graph tries to tell us:

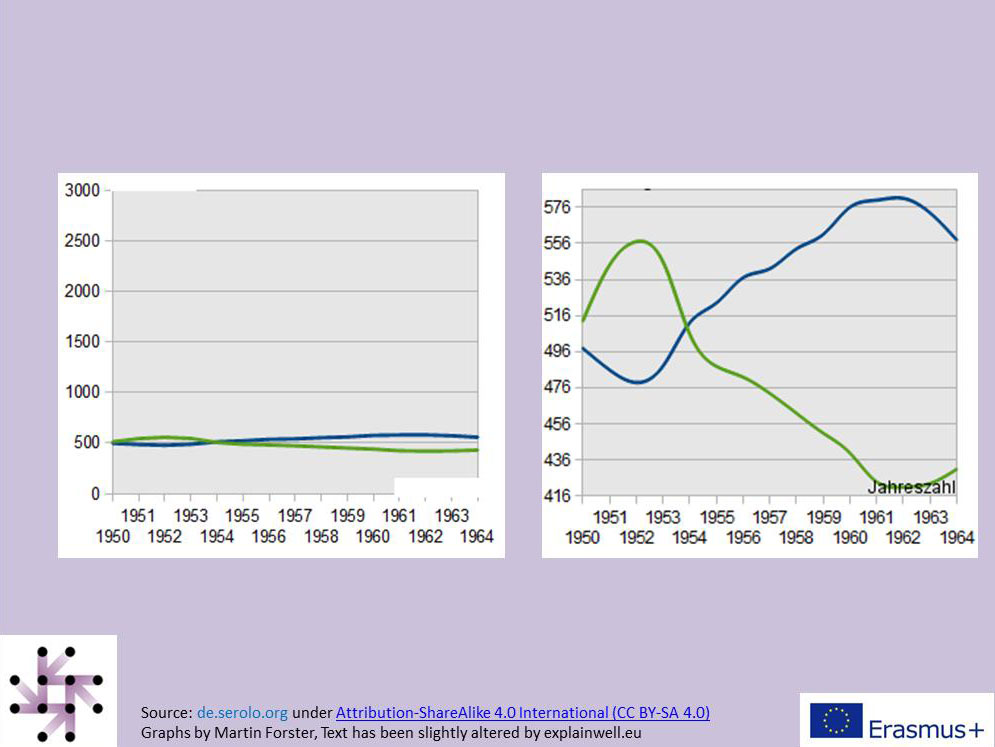
Now look at these 2 graphs about mice and kestrels. They look very different from the first one. What stories do they tell us?

But why are they so different even though they are based on the same data?
What is the truth? Remember the following sentence: „Never trust a diagram that you have not faked yourself.” It sounds like a joke but there is a lot of truth in in.
How you can interpret a diagram truthfully, you can learn in the next chapter.
Here you can view a video tutorial as introduction on reading an interpreting a line graph.


